

Location
Please select your investor type by clicking on a box:
We are unable to market if your country is not listed.
You may only access the public pages of our website.


We have been optimistic on the outlook for productivity growth for some time. This is partially because the paltry productivity gains of the last decade represent a low bar to clear. It is also partly because there is an impressive amount of research and development happening. In addition, China has now reached the technological frontier, effectively adding 1.4 billion more people to the effort to advance human knowledge.
But, in our view, the best reason to be optimistic about the productivity outlook is that there are exciting new technologies now being developed. The most exciting field may be that of artificial intelligence (AI), with high hopes in particular surrounding generative AI: a technology that generates text, images and other media by finding patterns in the copious data available on the internet (or elsewhere).
At a minimum, generative AI represents the next step up for internet searches. Existing search engines provide the user with a list of websites to visit related to the requested topic. Generative AI can summarize all of those websites into a single (usually) coherent report. The technology remains imperfect – creating phantom citations, allowing itself to be swayed by the way in which a question is asked, not sufficiently differentiating between high-quality and low-quality sources, and so on. But it is nevertheless a big advance in how the internet is effectively indexed (though one wonders who will bother to generate content for the underlying websites if they become increasingly subsumed by generative AI).
No less promisingly, when trained on the right data – and with necessary caveats about garbage-in, garbage-out – generative AI appears capable of performing such tasks as programming computer code, conducting detailed legal research, performing academic literature reviews, providing customer service, and much more. This technology is also helpful for composing simple, standardized content such as the details of a job posting. The applications will presumably broaden from there.
Artificial intelligence is also progressing quickly in the field of sensing. Voice-recognition is improving by leaps and bounds. Vision technology is improving to the point that self-driving cars are increasingly possible (admittedly a decade after they were first expected). Likewise object manipulation by robots is becoming more robust.
Outside of AI, new breakthrough health technologies include the vast potential for mRNA vaccines and the nearly infinite promise of genetic manipulation via CRISPR (Clustered Regularly Interspaced Short Palindromic Repeats).
Green-oriented technologies are also advancing quickly, as is the internet of things and quantum computing. Hope springs eternal for nuclear fusion. Virtual reality, distributed ledgers and 3D printing could also have growing applications.
In the short-run, enthusiasm over generative AI is sufficiently great that it should have a visible effect on capital expenditures in the short run. Some specialized computer chip manufacturers have already enjoyed a massive leap in their profits as corporations scramble to take advantage of the new technology or at least avoid being disrupted by it.
But we are dubious that the boost in capital expenditures will be large enough to offset recessionary forces in the short run. Businesses are expressing caution about investing given recession fears. There are also significant chokepoints both in the availability of the necessary computer hardware and in the number of workers with sufficient skills to operate them.
Another small positive influence in the short run comes via the wealth effect as the value of some technology companies has soared. This creates additional wealth, some of which might be recycled into the economy.
But probably the most useful takeaway is that new technologies often take surprisingly long to boost productivity. As economist Robert Solow opined in 1987, computers were everywhere except in the productivity statistics. The simple fact is that it takes time to refine new technologies, find useful applications for them, distribute them, teach workers how to use them, and integrate them into business operations. This took decades for computers. Successive new technologies are admittedly being integrated ever more quickly. But it is still prudent to imagine a delay of several years before productivity is greatly enhanced.
Over the long run, we believe productivity growth can rise somewhat faster than otherwise. It is hard to say by how much: whether productivity growth might just revive to something like +1.25% per annum, or instead soar to the heyday of +2.50% or even beyond. Much depends on whether any of these new technologies, with generative AI currently the mantle bearer, prove to be truly transformative on par with the invention of the internet itself. In turn, economic growth can ascend somewhat more quickly than otherwise, albeit with demographic pressures exerting the opposite influence. It is not so much that economic growth can accelerate in a better productivity environment; it’s that it doesn’t have to decelerate too badly despite a worse demographic one.
New technologies often lead to deflationary forces. We continue to assume that the long-term inflationary forces win out – including those emanating from de-globalization, climate change and the rising clout of workers. However, aging populations and rapid technological change do push in the other direction.
Lastly, some of these new technologies raise the spectre of significant job losses. Let the record show that this is not a new concern. Some jobs are almost always displaced as technology advances, and there has been great anxiety at different points in the past. But historically there have always been as many or more new – and frequently better – jobs created as have been lost. The reality is that new technologies usually end up helping workers do their job better rather than replacing them. Demand for a worker’s services can even rise when their cost per unit of output declines due to the help of artificial intelligence. To some extent, the proof is in the pudding: despite quite a lot of technological disruption in recent decades, unemployment rates are at their lowest levels in multiple generations.
Computers have long been better than humans at remembering things and at performing calculations. Now, they are beginning to match humans in understanding a diverse range of information without extensive guidance, from text on the internet to the visual flow of traffic on a street. To the extent jobs can be thought of as requiring a combination of such attributes (in addition to others for which machines still significantly trail, such as performing highly varied physical tasks and interpersonal communication), a significant number of jobs become vulnerable as computers gain these new competencies, while others will remain resistant for significantly longer.
It is much too early to say whether structural unemployment will actually rise due to the next generation of technologies. The risk feels higher than usual given the potentially rapid rate of technological change and the broad set of sectors affected. If this were to transpire, governments might respond with policy solutions that either provide greater financial transfers to the structurally unemployed or shield their jobs from some aspect of the technological change.
The debt ceiling was indeed resolved nearly two weeks ago, in line with our prediction from the previous #MacroMemo. The debt ceiling has now been waived for two years. This removes one source of uncertainty and a key downside economic risk from the path immediately ahead.
There are also three other debt ceiling-related items worth thinking about.
Normally, when governments borrow money, they then spend the money such that there isn’t a net reduction in economy-wide liquidity. But in this case, the government will borrow the money and then not spend it – this is a liquidity drain. We estimate that this should send the U.S. 10-year yield 11 basis points to 18 basis points higher, all else equal. Of course, markets know this and have likely already priced it in. Furthermore, this liquidity drain is merely the reversal of the significant liquidity boost over the prior four months when the Treasury General Account was drained and spent without proportionate tax revenue or bond issuance.
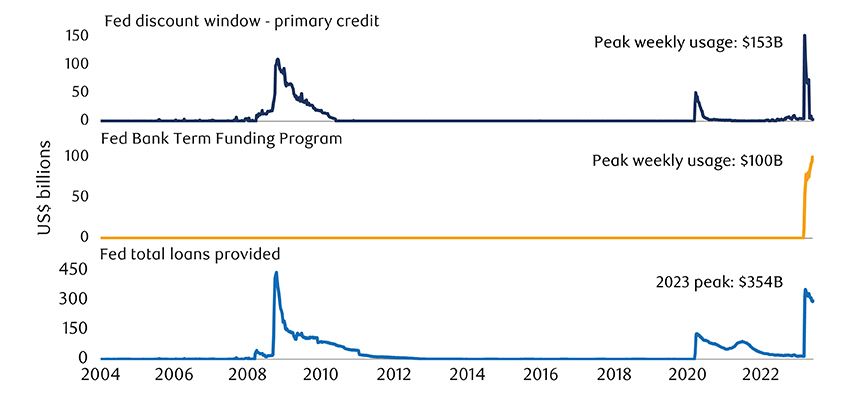
While there are still a handful of weak regional banks in the U.S., there mercifully haven’t been any new adverse developments recently. Given this lull, it is useful to try to better understand the various liquidity programs at the U.S. Federal Reserve and how to interpret the varying usage of each one (see next chart).
 As of 06/07/2023. Source: Federal Reserve, Macrobond, RBC GAM
At the top of the chart is the Fed’s discount window. This is a long-standing liquidity program intended for the use of banks with short-term liquidity needs. Given the potential reputational damage to banks using this window, it is generally only accessed in a significant way during periods of significant banking stress. Indeed, weekly usage rose from a nominal amount to as much as $153 billion during the recent U.S. banking stress and has since retreated almost all the way back to normal. It appears that the bulk of the usage may have been from the specific banks that encountered the most distress. Usage plummeted immediately after First Republic Bank was acquired by J.P. Morgan.
In contrast, the Fed’s new Bank Term Funding Program – the middle row of our chart -- remains in high demand. This program was created specifically for the recent round of banking stress, with generous collateral terms. There is thus still a measure of banking stress in the U.S. as banks take advantage of the one-year loan to address their diminished deposit bases.
Finally, the bottom row of our chart shows that the overall amount of money lent by the Fed has not significantly declined. How is this possible when discount window usage declined so sharply? It is because there is a third omitted category: the Fed provided special loans for the resolution of the two failed banks, as well as a loan to J.P. Morgan for acquiring the third bank. These are strategic loans that reflect banking stress that has been resolved, rather than banking stress underway.
In conclusion, the Fed’s balance sheet reveals a confusing mix of falling, steady and rising loan demand, depending on the program examined. We are inclined to set aside the strategic loans to the failed banks – those reflect historic stress rather than current stress. Instead, we view the reduction in discount window usage as a reflection of a reduction in the most extreme form of bank-endangering stress. The steady usage of the Bank Term Funding Program, however, shows that there is still a measure of pressure felt by some banks. The overall picture is better than it was a few months ago, but far from fully resolved.
China’s economic recovery has been sputtering lately:
We were skeptical that China would sustain a robust economic recovery when the country first opened its doors late last year. We now suspect there is too much pessimism about the Chinese economic outlook. Yes, the official manufacturing PMI signals contraction, but the three other national PMIs do not. Housing may not be booming, but it isn’t collapsing. Baidu (China’s Google equivalent) searches for the word “hotel” have skyrocketed, signaling an appetite for service-sector spending now that restrictions have vanished.
Most importantly, China is in a better position to deliver monetary or fiscal stimulus than almost any other country. Most countries must debate whether to focus on excessive inflation or insufficient growth, each arguing for the opposite policy solution. China, in contrast, has weak growth and low inflation – both calling for more economic stimulus.
To be sure, China seeks to avoid the excesses that have plagued other countries in their pandemic recoveries, and so should use a light touch if it acts. Furthermore, China will be reluctant to significantly revive the housing market – its historical go-to move – because excessive housing ebullience has created significant problems that are not yet fully resolved. These include undercapitalized builders, significant local government losses, poor housing affordability. But China can surely afford to cut interest rates a little or deliver a measure of fiscal stimulus targeted at encouraging consumer spending or business investment.
In short, we would still bet on a moderate economic recovery and 5%-plus economic growth for China in 2023. This would provide a welcome if incomplete counterbalance to anticipated economic weakness elsewhere in the world this year.
Despite the seeming constant of strong U.S. payrolls data – May delivered a big +339,000 print, well ahead of the +195,000 consensus – there are signs of a softening economy elsewhere. One needn’t look too far, with the unemployment rate up from 3.4% to 3.7%. One shouldn’t make too much of a 0.3 percentage point increase, but historically any increase of 0.5 percentage points or more has ultimately culminated in a recession. This isn’t that, but it’s fairly close.
How did the unemployment rate rise so much when hiring was strong? The unemployment rate comes from the household survey rather than the payrolls survey, and the household survey recorded a loss of 310,000 positions. It must be strenuously emphasized that the household survey is by far the more volatile of the two, and so it is far from automatic that employment has actually turned negative. But there is some informational value in that report and so perhaps hiring was not quite as strong as the +339,000 payrolls figure.
Elsewhere, jobless claims leapt higher, to 261,000 positions in the week of June 3 (see next chart). This was the highest number since October of 2021. Time will tell if the increase sticks, as it may have been distorted by Memorial Day. Indeed, the series has suffered from major and repeated revisions in recent months.
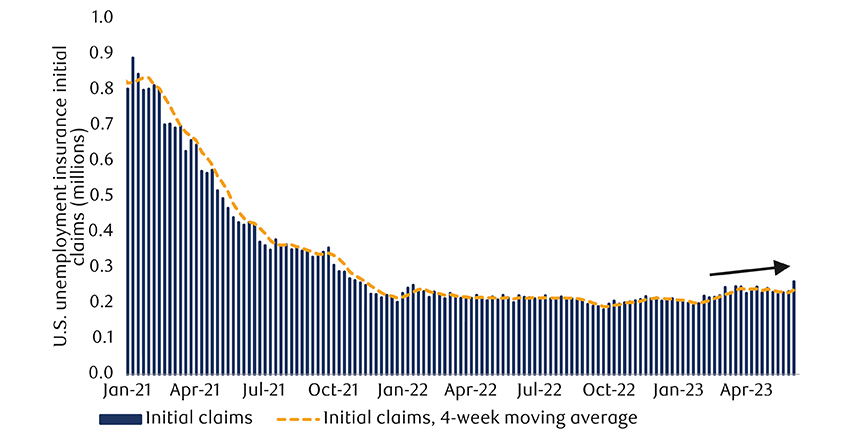 As of the week ending 06/03/2023. Source: U.S. Department of Labor, Macrobond, RBC GAM
The closely watched twin reports from the Institute for Supply Management (ISM) were also recently released for the month of May. Both were distinctly weak. The ISM Manufacturing Index fell slightly, from 47.1 to 46.9, both consistent with contraction in the manufacturing sector. The new orders component is now a puny 42.6, down 3 percentage points from the prior month.
For the longest time, the ISM Services Index defied this weakness, conveying solid economic growth early in the year. But the index has fallen steadily since then, with the May index at just 50.3 – barely in growth territory. The employment component was just 49.2, hinting at job losses across a broad swath of the economy.
Lastly in the U.S., the level of bank credit outstanding continues to contract. This confirms that tighter lending standards are now morphing into a credit chill (see net chart).
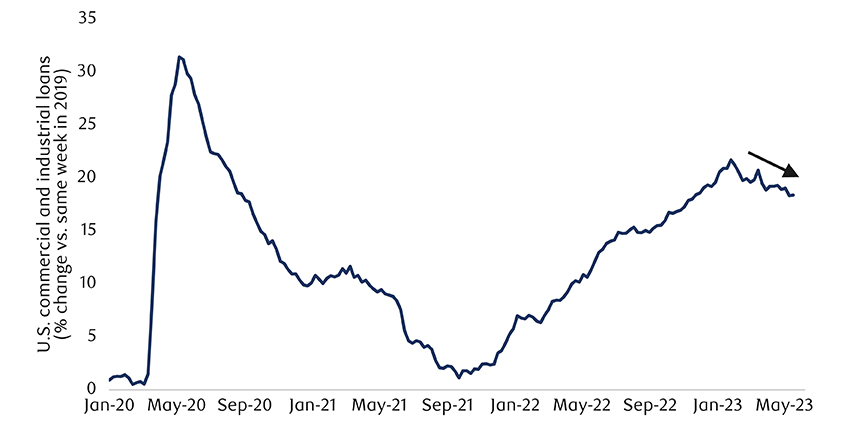 As of the week ending 05/31/2023. Source: Federal Reserve, Macrobond, RBC GAM
In Canada, Q1 GDP arrived at a strong and above-consensus +3.1% annualized growth rate. However, the final quarter of 2022 was revised down from 0.0% growth to -0.1% annualized, meaning that the economy contracted slightly.
Canadian employment in May was more pessimistic than in the U.S.: 17,000 net jobs were shorn during the month, the first negative print after eight consecutive monthly gains. The unemployment rate accordingly rose from 5.0% to 5.2%. But Canada’s job numbers are sufficiently bumpy that it is premature to conclude that the labour market is now in a recessionary retreat. The weakness was actually confined to young workers. Given the May timing when summer jobs often begin, this smacks of seasonal distortions after some unusual pandemic years. Time will tell whether Canadian employment is enduringly softening.
After Germany announced two consecutive quarters of declining GDP – short-hand for a recession – the Eurozone has just revised its own economic data in a way that yields the same outcome (see next chart). To be clear, this was primarily the effect of the energy shock that hit Europe and the U.K. harder than other jurisdictions. Energy prices have since retreated, dampening that headwind. But we still look for an interest-rate related recession over the second half of this year, in line with our view for most developed nations.
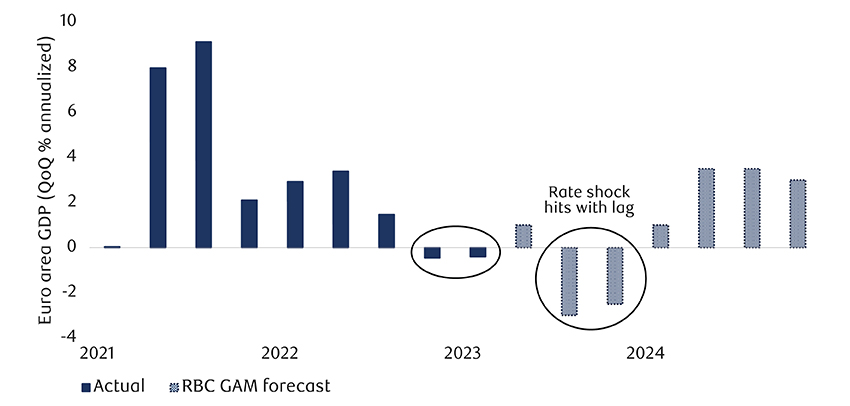 As of Q1 2023. RBC GAM forecast as of 04/28/2023. Source: Eurostat, Centre for Economic Policy Research (CEPR), Macrobond, RBC GAM
One risk to our forecast for a developed-world recession is the fact that some sectors appear to be going through economic corrections out of sync with one another. In fact, one could conceive of an economy-wide recession being avoided because each sector struggled at a different time rather than in unison. To illustrate:
The Bank of Canada surprised markets and ourselves with a 25 basis point rate hike to 4.75% on June 7. This outcome was always a possibility but had been assigned a less than 50% chance by markets.
The argument against tightening was that the Bank of Canada has just halted its tightening regime three months earlier. The Bank had indicated it planned to remain on hold for a period of time to assess the lagged effect of all the monetary tightening already conducted. Based on this positioning, our thinking was that the Bank of Canada could pause through the summer, and then revisit whether further tightening was needed in September.
But the Bank of Canada clearly became uncomfortable with the flow of economic data before then:
Employment has since weakened, we suspect May inflation will look better, and we don’t think housing strength will be sustained. But this is a combination of speculation and post-hoc information, and so the Bank pulled the trigger.
The market has now priced in a 63% chance of a further 25 basis point rate increase on July 12, and has it fully priced by September. This would take the overnight rate up to 5.0%.
When the Bank of Canada and Reserve Bank of Australia both surprised markets with additional monetary tightening, the odds palpably shifted elsewhere. Markets now assign the Fed a one-in-four-chance of a rate increase this week on June 14. The market then has priced in a 57% chance of a hike for the subsequent July 26 meeting. The economic rationale would be similar: for the moment the economy is still growing, April inflation was a bit high and housing is rebounding.
We believe inflation has since eased somewhat (see next chart) making near-term tightening far from automatic. However, a mid-summer rate increase would not be a shock.
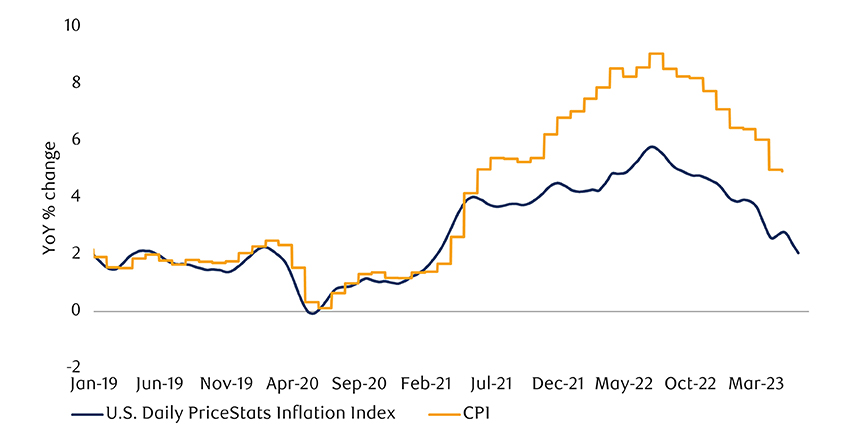 PriceStats Inflation Index as of 06/06/2023. Consumer Price Index (CPI) as of April 2023. Source: State Street Global Markets Research, RBC GAM
Elsewhere, both the European Central Bank and the Bank of England are on track for a 25 basis point rate increase at their own June meetings.
Looking further ahead, this is a time of particularly high uncertainty for monetary policy. Over the next six months, one could easily conceive of scenarios involving higher rates, flat rates or lower rates. Over the next several years, the most likely scenario is certainly lower rates, but with significant uncertainty over how much lower. We could return to historically stimulative territory like 0—2% as the economy recovers from recession or move to the theoretically neutral territory of 2—3%. Or we could remain at restrictive levels if inflation proves sticky.
It is easy enough to gauge which country has the largest economy. It would be China, if one looks at the amount of goods and services produced (via purchasing power parity exchange rates). But it would be the U.S. if one cares instead about the amount of money generated by that production (via market exchange rates).
But what about power more generally? In a world of geopolitical frictions, there is some value in keeping an eye on which country is the most powerful when examined through not just an economic lens, but one that encompasses the bigger picture of military strength, order, financial market clout, resource wealth, debt, inequality, governance, and so on. There are a number of third-party metrics that attempt to gauge national power. Ray Dalio’s Country Power Index is arguably the most comprehensive.
It shows that the U.S. retains a material though not enormous lead over China, with China well ahead of the Eurozone (see next chart). Other nations lag substantially behind. Germany leads Japan, South Korea and then the U.K. So if one were to broaden the analysis to which clique of countries wields the most power, it would certainly be Western nations. That said, if the gauge were instead which countries are growing most in national power, one could imagine that China and some of its Asian and African brethren could brag about the largest increases. Dalio does not publish historical data, however, so this is just an educated guess.
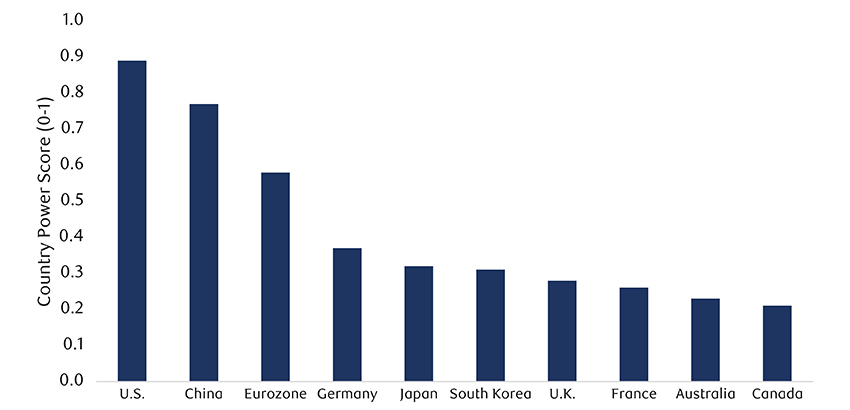 As of January 2023. Country Power Index is calculated based on 18 major factors from Principles for dealing with the changing world order. Source: Ray Dalio, RBC GAM
-With contributions from Vivien Lee, Thao Le and Aaron Ma
Subscribe now to receive the latest investment and economic insights from our experts, sent straight to your inbox.
This document is a marketing communication and it may be produced and issued by the following entities: in the European Economic Area (EEA), by BlueBay Funds Management Company S.A. (BBFM S.A.), which is regulated by the Commission de Surveillance du Secteur Financier (CSSF). In Germany, Italy, Spain and Netherlands the BBFM S.A is operating under a branch passport pursuant to the Undertakings for Collective Investment in Transferable Securities Directive (2009/65/EC) and the Alternative Investment Fund Managers Directive (2011/61/EU). In the United Kingdom (UK) by RBC Global Asset Management (UK) Limited (RBC GAM UK), which is authorised and regulated by the UK Financial Conduct Authority (FCA), registered with the US Securities and Exchange Commission (SEC) and a member of the National Futures Association (NFA) as authorised by the US Commodity Futures Trading Commission (CFTC). In Switzerland, by BlueBay Asset Management AG where the Representative and Paying Agent is BNP Paribas Securities Services, Paris, succursale de Zurich, Selnaustrasse 16, 8002 Zurich, Switzerland. The place of performance is at the registered office of the Representative. The courts at the registered office of the Swiss representative or at the registered office or place of residence of the investor shall have jurisdiction pertaining to claims in connection with the offering and/or advertising of shares in Switzerland. The Prospectus, the Key Investor Information Documents (KIIDs), the Packaged Retail and Insurance-based Investment Products - Key Information Documents (PRIIPs KID), where applicable, the Articles of Incorporation and any other document required, such as the Annual and Semi-Annual Reports, may be obtained free of charge from the Representative in Switzerland. In Japan, by BlueBay Asset Management International Limited which is registered with the Kanto Local Finance Bureau of Ministry of Finance, Japan. In Asia, by RBC Global Asset Management (Asia) Limited, which is registered with the Securities and Futures Commission (SFC) in Hong Kong. In Australia, RBC GAM UK is exempt from the requirement to hold an Australian financial services license under the Corporations Act in respect of financial services as it is regulated by the FCA under the laws of the UK which differ from Australian laws. In Canada, by RBC Global Asset Management Inc. (including PH&N Institutional) which is regulated by each provincial and territorial securities commission with which it is registered. RBC GAM UK is not registered under securities laws and is relying on the international dealer exemption under applicable provincial securities legislation, which permits RBC GAM UK to carry out certain specified dealer activities for those Canadian residents that qualify as "a Canadian permitted client”, as such term is defined under applicable securities legislation. In the United States, by RBC Global Asset Management (U.S.) Inc. ("RBC GAM-US"), an SEC registered investment adviser. The entities noted above are collectively referred to as “RBC BlueBay” within this document. The registrations and memberships noted should not be interpreted as an endorsement or approval of RBC BlueBay by the respective licensing or registering authorities. Not all products, services or investments described herein are available in all jurisdictions and some are available on a limited basis only, due to local regulatory and legal requirements.
This document is intended only for “Professional Clients” and “Eligible Counterparties” (as defined by the Markets in Financial Instruments Directive (“MiFID”) or the FCA); or in Switzerland for “Qualified Investors”, as defined in Article 10 of the Swiss Collective Investment Schemes Act and its implementing ordinance, or in the US by “Accredited Investors” (as defined in the Securities Act of 1933) or “Qualified Purchasers” (as defined in the Investment Company Act of 1940) as applicable and should not be relied upon by any other category of customer.
Unless otherwise stated, all data has been sourced by RBC BlueBay. To the best of RBC BlueBay’s knowledge and belief this document is true and accurate at the date hereof. RBC BlueBay makes no express or implied warranties or representations with respect to the information contained in this document and hereby expressly disclaim all warranties of accuracy, completeness or fitness for a particular purpose. Opinions and estimates constitute our judgment and are subject to change without notice. RBC BlueBay does not provide investment or other advice and nothing in this document constitutes any advice, nor should be interpreted as such. This document does not constitute an offer to sell or the solicitation of an offer to purchase any security or investment product in any jurisdiction and is for information purposes only.
No part of this document may be reproduced, redistributed or passed on, directly or indirectly, to any other person or published, in whole or in part, for any purpose in any manner without the prior written permission of RBC BlueBay. Copyright 2023 © RBC BlueBay. RBC Global Asset Management (RBC GAM) is the asset management division of Royal Bank of Canada (RBC) which includes RBC Global Asset Management (U.S.) Inc. (RBC GAM-US), RBC Global Asset Management Inc., RBC Global Asset Management (UK) Limited and RBC Global Asset Management (Asia) Limited, which are separate, but affiliated corporate entities. ® / Registered trademark(s) of Royal Bank of Canada and BlueBay Asset Management (Services) Ltd. Used under licence. BlueBay Funds Management Company S.A., registered office 4, Boulevard Royal L-2449 Luxembourg, company registered in Luxembourg number B88445. RBC Global Asset Management (UK) Limited, registered office 100 Bishopsgate, London EC2N 4AA, registered in England and Wales number 03647343. All rights reserved.
Subscribe now to receive the latest investment and economic insights from our experts, sent straight to your inbox.
Please choose from the following
We are unable to market if your country is not listed.
You may only access the public pages of our website.