
Location
Please select your investor type by clicking on a box:
We are unable to market if your country is not listed.
You may only access the public pages of our website.


Our latest monthly economic webcast is now available, kicking off the New Year. It is entitled “Glimmers of hope amid dark clouds” (and, for the cinephiles, marks a big leap forward in video and audio quality).
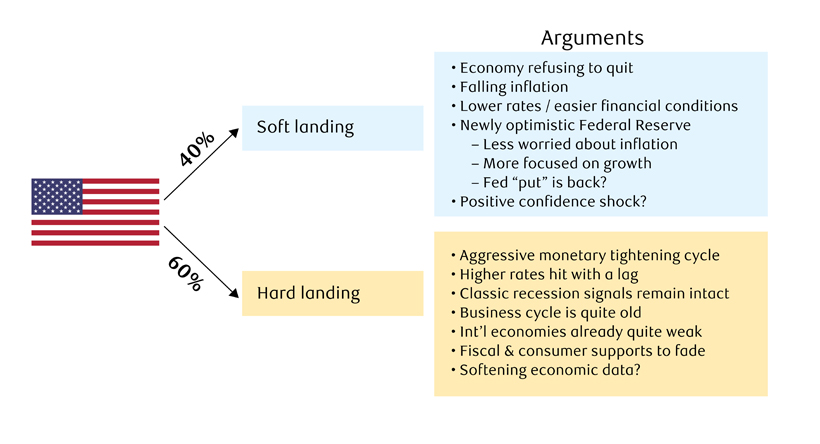
The likelihood of an economic soft landing have increased. Avoiding a recession has always been conceivable, but the probability has lately gone up. We now assign a likelihood of 40% for a soft landing in the U.S., up from the prior 30% (see next graphic). Conversely, the likelihood of a hard landing – a recession – has fallen from 70% to 60%. The stock market and risk assets more generally are not ignorant of this shift, rallying enthusiastically in recent months.
As at 01 08 2024. Source: RBC GAM
What motivates this shift? As a starting point, the U.S. economy has simply refused to quit. It continues to pump out quarters of robust growth even as economic theory, historical experience and leading indicators suggest it should be wobbling and soon contracting. When the economy surprises so persistently to the upside, it can no longer be viewed as a coincidence.
As bond yields rose over the late summer and fall of 2023, we flagged that this would act as an additional drag on economic activity, increasing the likelihood of a recession. It would be inconsistent not to make the opposite observation today. Bond yields have since plummeted, with the U.S. 10-year yield descending by a full percentage point in less than three months, from a high of 4.99% in mid-October to 3.99% today. Financial conditions have eased by even more than this, as risk assets have simultaneously rallied (see subsequent chart). The likelihood of recession in a 4% interest-rate world is lower than in a 5% world.
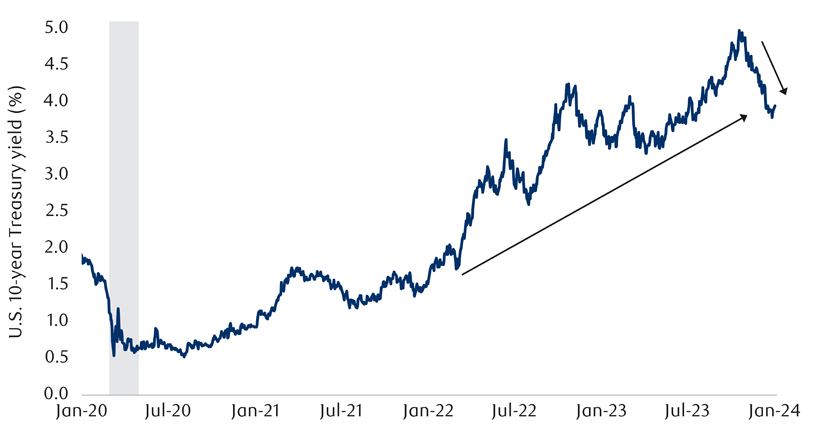
As of 01/02/2024. Shaded area represents recession. Sources: U.S. Treasury, Macrobond, RBC GAM
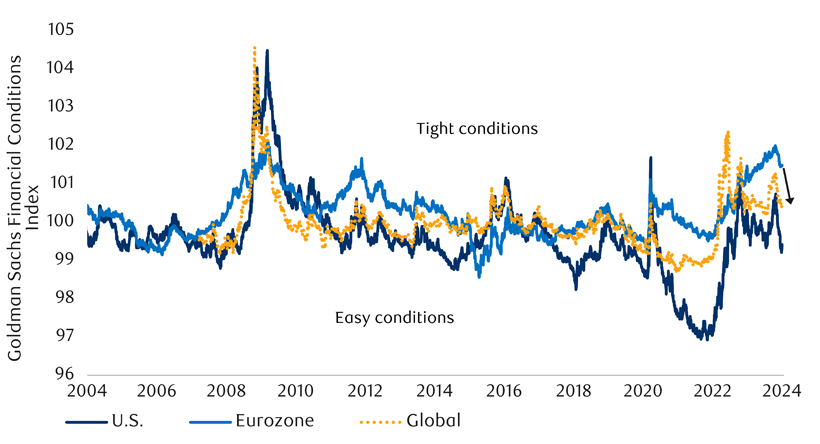
As of 01/03/2024. Sources: Goldman Sachs, Bloomberg, RBC GAM
Inflation has now fallen considerably (see next chart). One can still debate whether developed-world inflation will get stuck at 3.5% versus returning neatly to 2.0%, but the idea that it might become stuck at a problematic 5% or a horrific 10% can now realistically be dismissed. This not only means that the corrosive effect of high inflation has diminished, but that interest rates can fall.
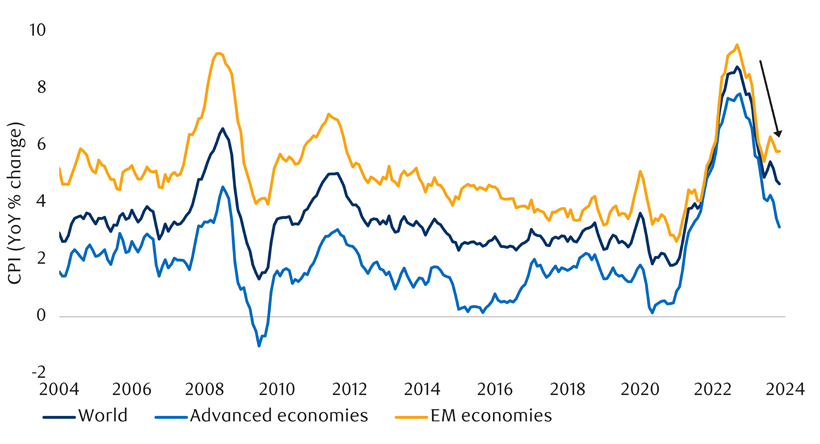
As of November 2023. Sources: Haver Analytics, Macrobond, RBC GAM
On this last front, the U.S. Federal Reserve’s policy pivot on December 13 is noteworthy. The Fed’s closely watched dot plots conveyed the fresh expectation of an additional two 25 basis point rate cuts in 2024. This means that Federal Reserve participants now anticipate significant monetary easing in the near term (see next chart). In the accompanying press conference, Fed Chair Powell noted that the economy is not currently in recession, downplayed the risk of a recession in the future, celebrated improving inflation, and indicated that rate cuts should begin well before inflation descends to the central bank’s 2.0% target.
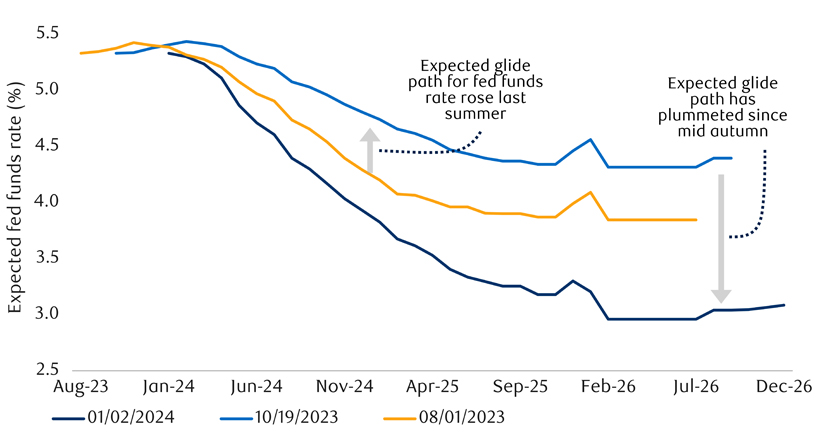
As of 01/02/2024. Sources: Bloomberg, RBC GAM
The Fed’s diminished concern about inflation is heartening in its own light given that it employs hundreds of sophisticated economists and analysts who must be seeing encouraging signs. In turn, the Fed can afford to shift a portion of its attention from inflation toward growth. Naturally, this is good for the economic growth outlook.
Put differently, the Fed’s pivot argues that some semblance of the famous ’Fed put’ is now back. If bad things were to happen to the economy or markets, the Fed is now in a better position to respond supportively, whereas high inflation previously precluded any such support.
Combined, the good news about the economy, inflation and monetary policy appears to be inducing a positive confidence shock, further propelling the economy forward. The rising stock market and a recent increase in consumer sentiment indices are good examples of this.
Thus, a soft-landing outcome is the most achievable it has been in at least two years.
Despite all of that, we still believe a recession is the moderately more likely of the two scenarios.
Even after the recent decline in bond yields, interest rates are still substantially higher than they were a year ago, and massively above the levels of 2020. This is still one of the most aggressive monetary tightening cycles in modern history.
Furthermore, the anticipated recession may not actually be behind schedule (see next graphic). Historically the average gap between the Fed’s first rate hike and the onset of recession is consistent with a recession starting in June of this year. Now that the Fed has likely reached its cycle peak, we can also say that the historical average gap between the Fed’s last rate hike and the onset of recession would argue for a recession beginning in April.
To be fair, the actual historical experience has varied enormously from one cycle to the next. But the historical average argues that the recession isn’t behind schedule and that it could be arriving soon.
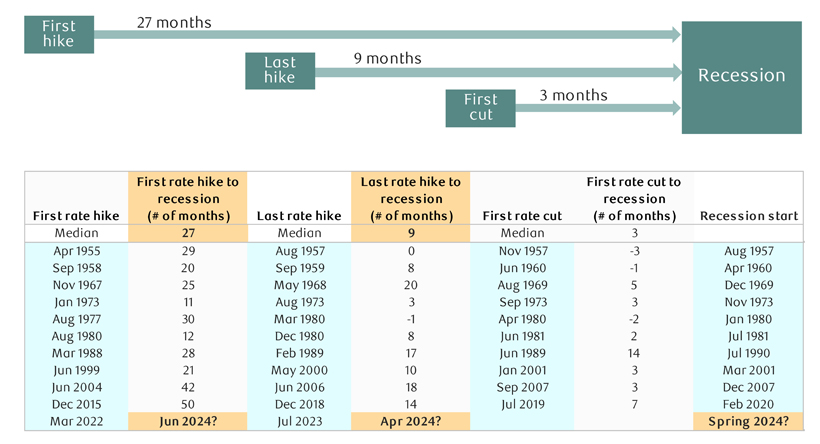
As at 01/02/2024. U.S. business cycles and tightening cycles. Sources: Federal Reserve, National Bureau of Economic Research (NBER), Macrobond, RBC GAM
While it will undeniably be helpful if reduced inflation does indeed enable central banks to cut interest rates more briskly into any burgeoning economic weakness, central banks nearly always cut interest rates at the onset of recessions, and yet the recessions nevertheless occur. The rate cutting is either insufficient or too lagged to avoid the bad economic outcome altogether.
Advanced economies outside of the U.S. are already suffering considerably. Economic activity is stagnating at best in the Eurozone, U.K. and Canada (see next two charts), with nowcasting pointing to further stagnation or even outright decline in the next quarter.
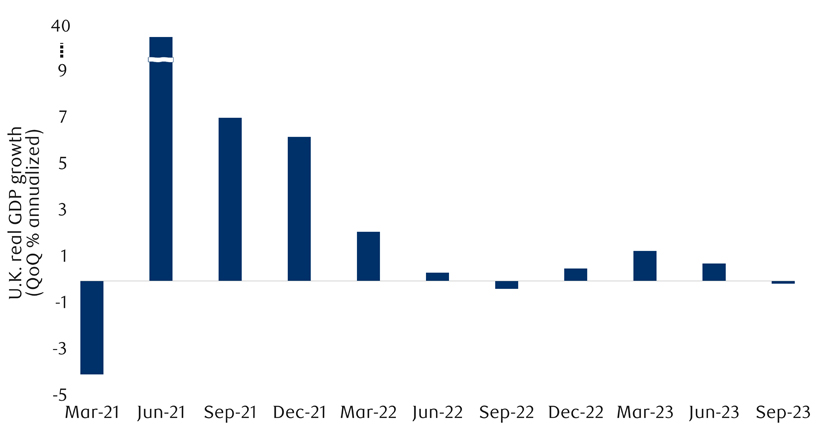
As of Q3 2023. Sources: Office for National Statistics (ONS), Macrobond, RBC GAM
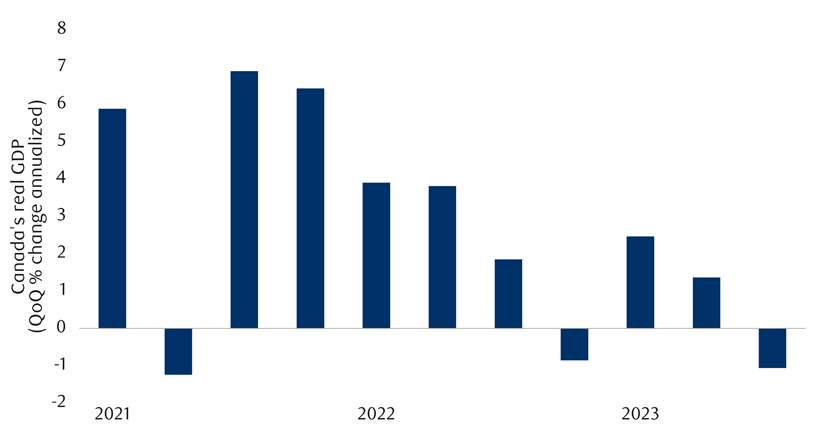
As of Q3 2023. Sources: Statistics Canada, Macrobond RBC GAM
The U.S. economy has undeniably been the exception through all of this, stubbornly continuing to grow. The third quarter gross domestic product (GDP) for 2023 was particularly remarkable, and the fourth quarter is tracking moderate growth. However, there are two reasons to believe the U.S. may yet stumble in the future. The first is simply observational in nature: U.S. economic data hasn’t been as reliably good lately.
As a loose summary of this, the U.S. data change index abruptly stopped improving a few months ago (see next chart). Even the seemingly robust December payrolls number was not as good as it first looked (discussed later in this report). The Fed’s own Beige Book provides a useful qualitative summary of recent trends, finding that 8 of 12 regional districts are stagnating or in slight economic decline.
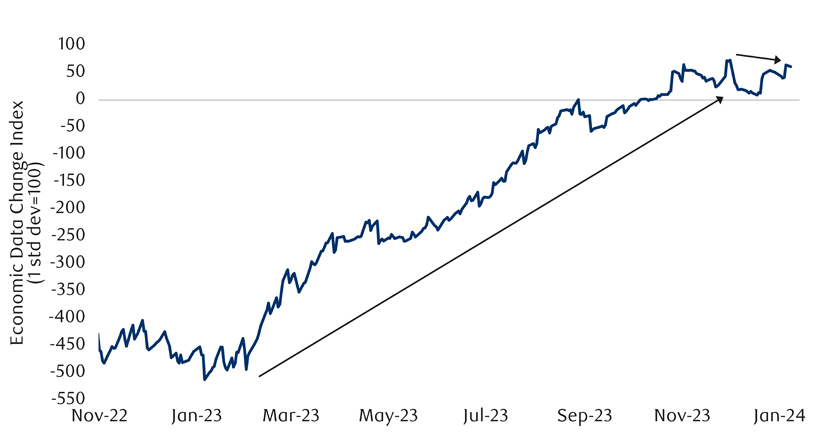
As of 01/08/2024. Sources: Citigroup, Bloomberg, RBC GAM
The second reason to expect slower U.S. growth is that the special factors that made the U.S. so exceptional in 2023 should fade in 2024. There were three main reasons why the U.S. economy outperformed the rest in 2023: lower interest rate sensitivity, more generous fiscal support and more enthusiastic consumer spending.
The U.S. economy remains somewhat less interest-rate sensitive than the others, but pain is nevertheless starting to mount in a variety of ways, including via bank losses, housing market weakness and rising credit card delinquency rates (see next chart). This credit card development, combined with the observation that American consumers have now worked through a significant chunk of their pandemic savings augurs for less extravagant consumption in 2024.
Lastly, budgetary experts anticipate an outright fiscal drag in 2024, as opposed to the fiscal boost that buoyed 2023 (see subsequent chart).
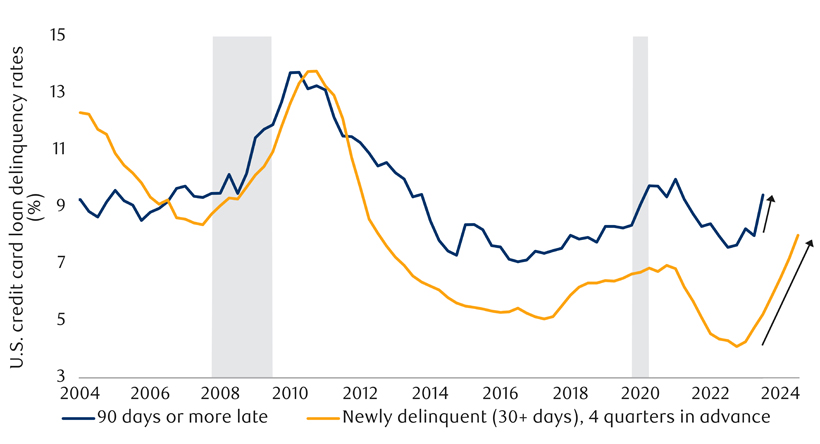
As of Q3 2023. Shaded area represents recession. Sources: Federal Reserve Bank of New York, Macrobond, RBC GAM
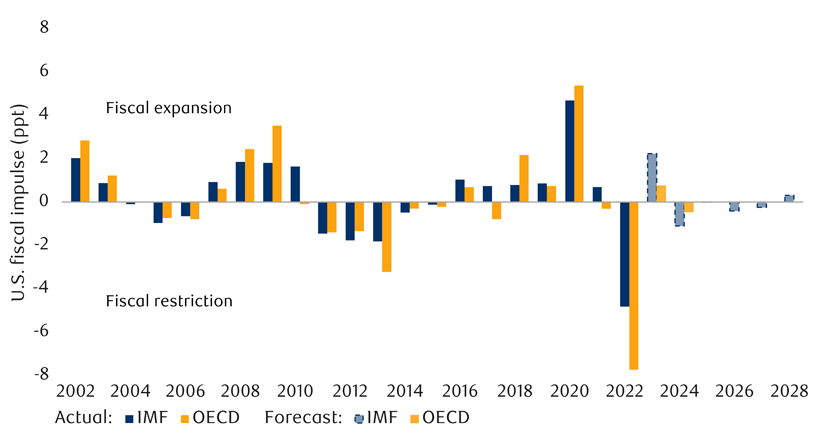
Fiscal impulse is defined as the change in general government structural balance as percentage of potential GDP from the previous year multiplied by minus one. Sources: International Monetary Fund (IMF) World Economic Outlook October 2023, OECD (Organisation for Economic Co-operation and Development) Global Economic Outlook, June 2023, Macrobond, RBC GAM
Our compilation of recession heuristics still points more toward ‘yes’ than toward ‘no’ (see next chart). If a recession is ultimately avoided, much of the recession playbook for economists will have to be blown up.
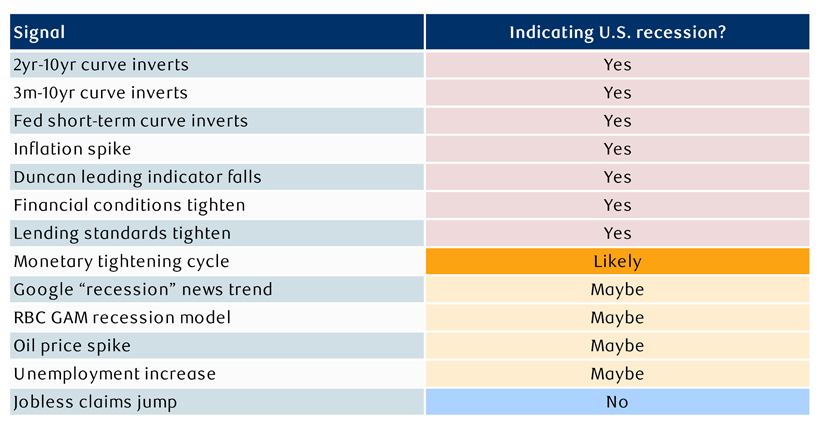
As of 10/29/2023. Analysis for U.S. economy. Source: RBC GAM
Similarly, our business cycle scorecard continues to insist that this is quite a late point in the economic cycle, even if it cannot say with conviction whether this is the end of the cycle, already the start of a recession, or merely ‘late cycle.’
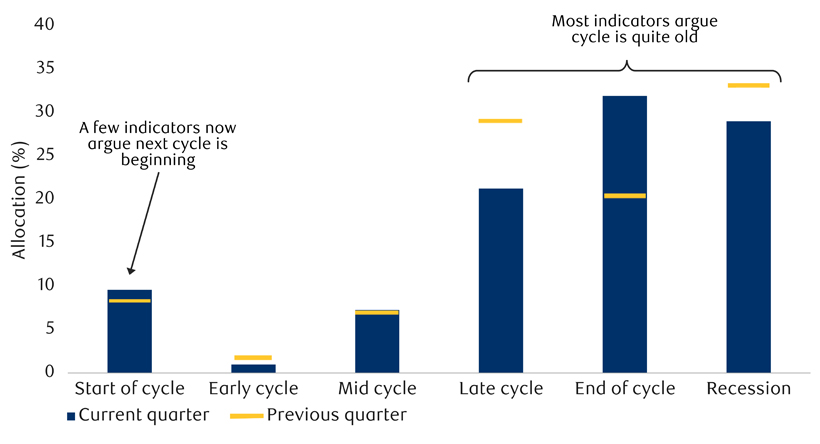
As at 11/03/2023. Calculated via scorecard technique by RBC GAM. Source: RBC GAM
From a risk-reward standpoint, economists may continue to think there is a real chance of a recession (see next chart), but financial markets are considerably more skeptical about the chance of a recession. Not only has the stock market rallied in recent months, but S&P 500 earnings expectations are for a robust 11.4% increase in 2024. This is historically consistent with whopping real GDP growth of +5.0% year-over-year!
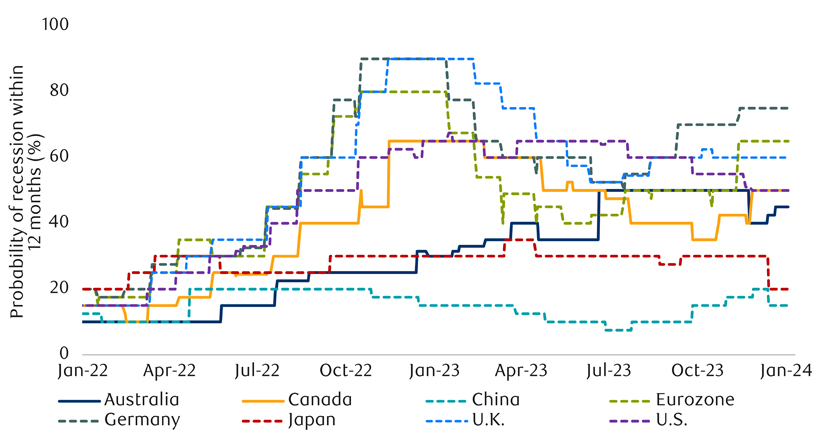
As of 01/03/2024. Median probability of recession based on latest forecasts submitted to surveys conducted by Bloomberg. Sources: Bloomberg, RBC GAM
The soft-landing scenario is now a very crowded trade. Combined with the fact that U.S. equities no longer enjoy a risk premium over bonds, it still makes sense to maintain a more cautious allocation to equities than the norm, despite our assessed increase in the likelihood of a soft landing from 30% to 40%.
Of course, the situation is hardly static. New economic data and other developments arrive nearly every day. Just a few months ago bond yields were screaming higher. Now, they are doing the opposite. It is entirely conceivable that some big new twist occurs over the coming quarters, changing the calculus yet again.
Pandemic-induced supply chain problems were a key part of the inflation explosion in 2021 and 2022. Those have since been nearly entirely resolved – a big part of the inflation success story over the past 18 months.
However, while not exactly back in focus, supply chains should at least stay within our peripheral vision. Houthi rebels in Yemen have taken to bombarding ships transiting through the Red Sea, interrupting traffic through the Suez Canal and thus the flow of international trade between Asia and Europe. Around 12% of global trade and 30% of global container traffic normally transits through the Suez Canal.
Despite the arrival of U.S. ships designed to discourage further attacks and to intercept further rockets, several of the world’s largest shipping companies are now avoiding the route, adding as much as 25% more time to trips. As the saying goes, time is money, and so this threatens to increase the cost of the goods being shipped.
Coincidentally, the world’s other major trans-oceanic canal – the Panama Canal – is also struggling. Water levels are too low after a drought. Ship throughput has already been depressed for several months and is anticipated to remain at just half the normal level through at least February, with repercussions set to linger well into 2024. Some of these ships are also forced to carry less cargo so as to sit higher in the water.
Slots through the canal are auctioned off whenever there is a cancellation. Such slots have gone for as much as US$4 million dollars recently, far higher than the US$173,000 average last year.
For all of that, the cost of container shipping has only increased moderately so far (see next chart). But the cost of dry bulk shipping has soared (though a fair portion of the latest spike has already reversed – see subsequent chart).
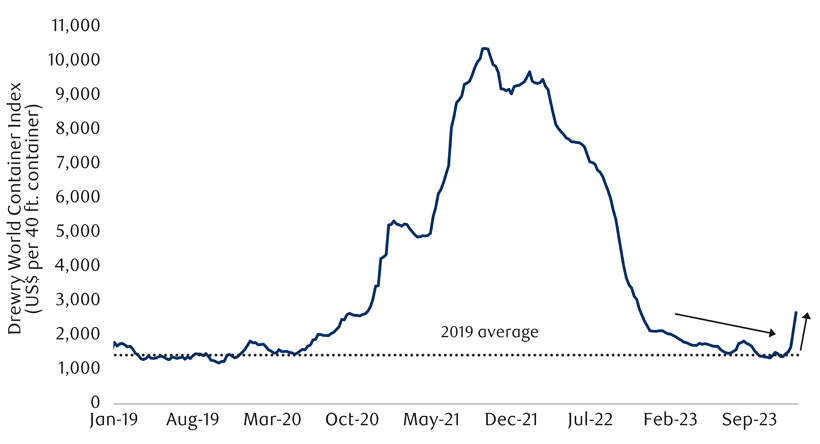
As of the week ending 01/04/2024. Sources: Drewry Shipping Consultants Ltd., Macrobond, RBC GAM
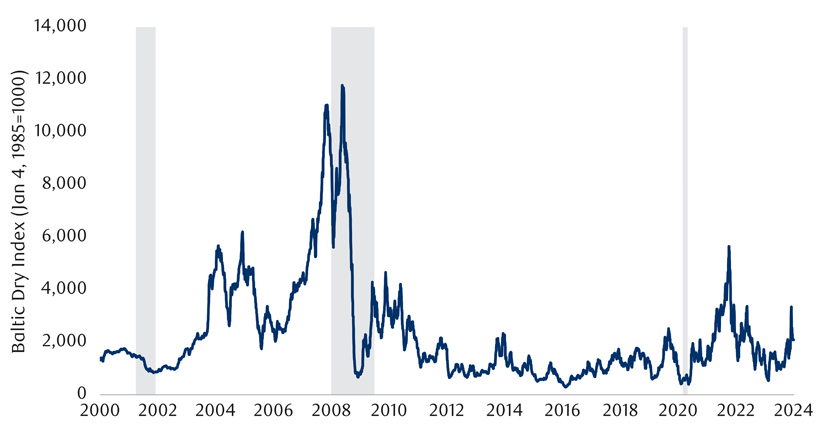
As of 01/02/2024. Shaded area represents recession. Sources: Baltic Exchange, Macrobond, RBC GAM
Our base-case scenario does not include supply chain problems sending inflation materially higher again. But it does constitute a relatively new risk.
With the Federal Open Market Committee (FOMC) meeting in mid-December, the Federal Reserve made the clearest break from rate hikes to rate cuts of any of the developed world’s major central banks.
But it has to be said that this is a curious development. The U.S. is not the obvious candidate for earlier or more aggressive rate cutting. Its economy is less interest-rate sensitive than the rest, reducing the urgency to cut rates. The U.S. inflation rate is not especially low relative to its peers.
The U.S. economy is arguably the strongest of the bunch in its current state, reducing the extent to which rate cuts are needed for demand-related reasons. Unlike some central banks like the Bank of England, the Fed doesn’t even anticipate a domestic recession.
Instead, it may just be that the Fed is being more transparent than the rest. Our suspicion is that most central banks have similar base-case plans to moderately reduce their policy rates in 2024. However, they see little reason to acknowledge those plans ahead of time given that the market response would prematurely undo the monetary tightening currently in place. Our index of global central bank actions confirms that rate hiking is already starting to be replaced by a pattern of early, largely emerging market rate cutters (see next chart).
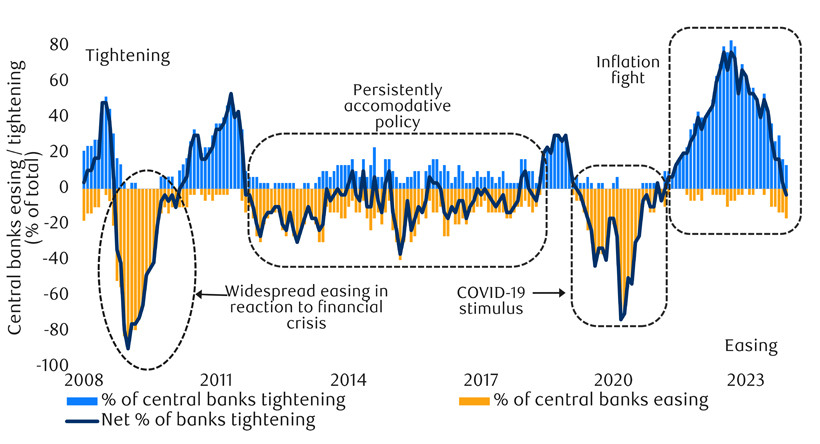
As of 12/29/2023. Based on policy rates for 30 countries. Sources: Haver Analytics, RBC GAM
Why has the Fed opted to be more transparent than the rest? A significant part of the story is that the Fed is among a small handful of central banks that explicitly publish their expected policy rate. It is difficult to conceal plans for rate cuts when they are mechanically laid bare for all to see on a quarterly basis.
But it is also fair to argue that Fed Chair Powell was probably more dovish in his remarks than he strictly needed to be. This may simply have been a misstep. Some subsequent Fed speakers have sought to walk back the market’s expectation for a March rate cut. The Fed Minutes from the same meeting highlight upside inflation risks and that FOMC members still expect interest rates to remain high for some time.
Powell’s candour has also unleashed more dovish talk from some other central banks. The Bank of Canada’s early-December statement stuck to the hawkish script, flagging that the central bank “remains prepared to raise the policy rate further if needed.” And yet, in an interview just after the Powell comments in mid-December, Governor Macklem talked openly about potential rate cuts in 2024.
Several political events arrive quite early in the New Year.
The U.S. Republican presidential nomination battle begins in earnest on January 15 with the Iowa caucus, followed by New Hampshire and Nevada primaries over the following weeks. There isn’t much doubt that Trump will win these as he enjoys a substantial lead. However, a critical question is whether trailing candidates Haley or DeSantis can consolidate sufficient support in second place to mount a genuine challenge later in the race.
From a U.S. fiscal standpoint, the next risk of a government shutdown is fast-approaching. Portions of the government are set to be shuttered on January 20 and then the remainder on February 3 if a 2024 budget is not struck. Having already dodged two such deadlines in October and November, the smart money is on another resolution, avoiding the economic pain that would be associated with a shutdown.
The federal government will furthermore have to decide whether to extend its special liquidity program for financial institutions past its March expiry date, as U.S. banks continue to carry significant mark-to-market losses on their investment securities (see next chart).
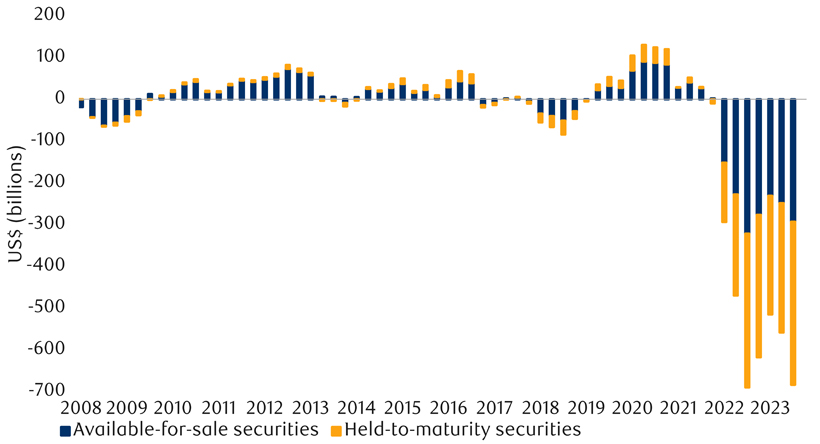
As of Q3 2023. Sources: FDIC, Macrobond, RBC GAM
Finally, 2024 is a busy year for international elections, as we discussed in the last #MacroMemo. Up imminently is a Taiwanese election on January 13 and then an Indonesian election on February 14. In both cases, the ruling party is favoured.
A major reason why it remains so difficult to tease out whether a soft landing or a hard landing is about to occur is that both expect the economy to slow somewhat.
The difference is that the soft-landing scenario envisions the economy slowing from a position of mild overheating (see next chart) to operating at the economy’s potential or slightly below it, whereas the hard landing scenario expects the economy to cool significantly more than that. The problem is therefore that the first part of a hard landing looks pretty much the same as the entirety of a soft landing.
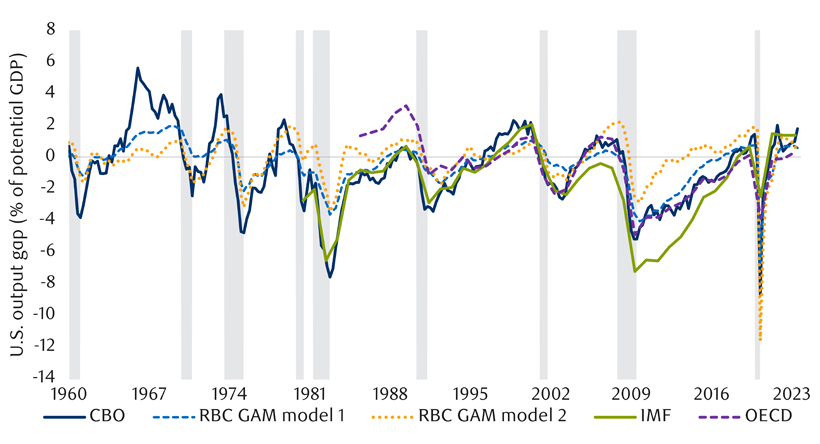
Congressional Budget Office (CBO), GAM model 1 and 2 estimates as of Q3 2023, IMF estimates as of Oct 2023, OECD estimates as of June 2023. GAM model 1 estimated using CBO natural rate of unemployment; GAM model 2 estimated using HP filter trends. Shaded area represents recession. Sources: Macrobond, RBC GAM
There are no easy solutions to this problem, other than to watch for evidence that any economic deceleration persists beyond the soft-landing point of debarkation.
What follows is a brief survey of some key economic data points.
PMIs are always worth tracking given their history as leading indicators for their host economies. In the closely watched U.S. market, the ISM (Institute for Supply Management) Manufacturing Index for December managed a slight gain but remained in a state of mild contraction (up from 46.7 to 47.4).Meanwhile the ISM Services Index fell materially, though merely to a level signaling modest growth (from 52.7 to 50.6).
Curiously, the employment sub-component of the latter indicator crashed from an anemic 50.7 to a catastrophic 43.3. This is strange because the service sector has been the side of the economy that has continued to generate jobs according to the U.S. payrolls survey.
Turning from the U.S. to the global PMI picture, this has now been in contraction mode for 14 consecutive months (see next chart). That’s a record dating back to when the series begins in the late 1990s. Past contractions that have approached this length have been associated with economy-wide recessions.
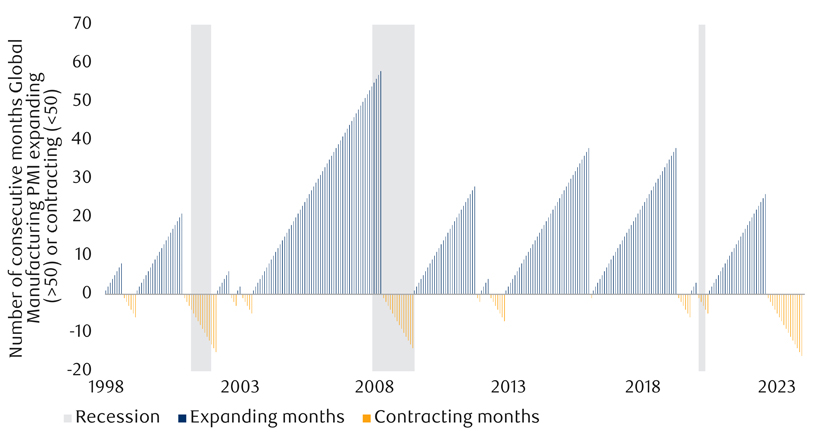
As of December 2023. Sources: J.P. Morgan, S&P Global, Haver Analytics, RBC GAM
How to interpret this fact is where it gets tricky. An optimist would note that the global manufacturing sector has apparently been in a decline for quite some time, and yet this has failed to trigger a broader recession. Perhaps the manufacturing sector just doesn’t pack the punch that it once did, or the rest of the economy is especially resilient.
Conversely, a pessimist would note that it is never good when important parts of the global economy are contracting, and that something is clearly not right.
On balance, it feels too clever by half to argue that bad data is good news, so we lean toward the more pessimistic interpretation.
The headline for U.S. payrolls in December was the above-consensus creation of 216,000 net new jobs versus a consensus forecast of 175,000. Despite this, the report was ultimately a disappointment, for several reasons:
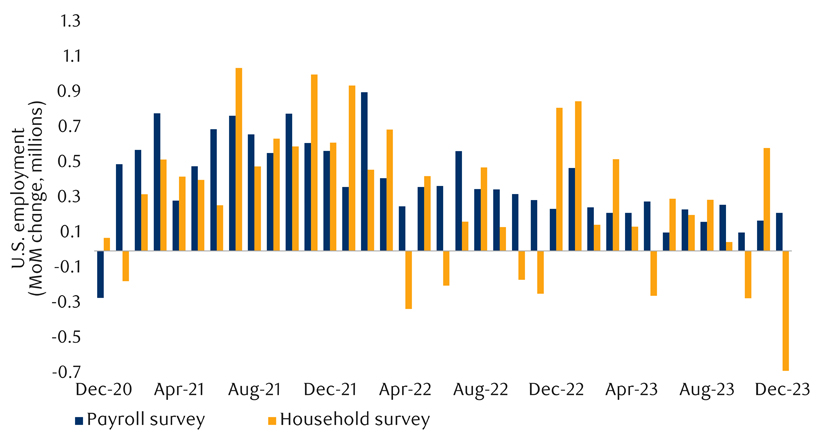
As of December 2023. Sources: Bureau of Labor Statistics, Macrobond, RBC GAM
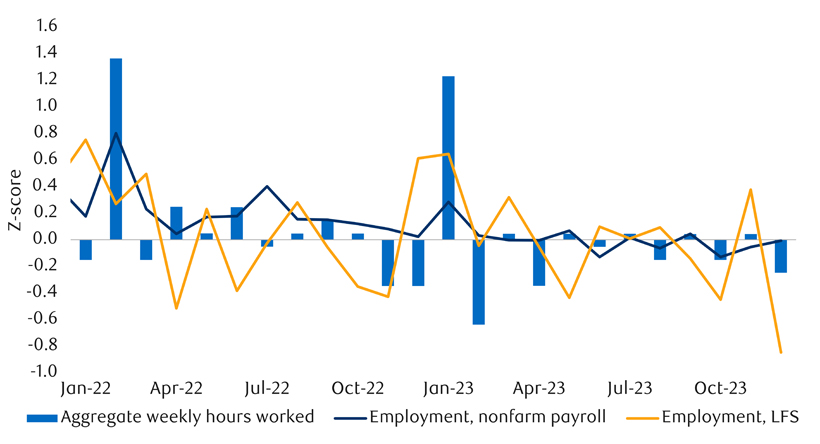
As of December 2023. Z-score of month-over-month % change of U.S. employment from nonfarm payroll and Labor Force Survey (LFS) and aggregate hours worked based on data since 1964. Sources: BLS, Macrobond, RBC GAM
With contributions from Vivien Lee and Aaron Ma
Subscribe now to receive the latest investment and economic insights from our experts, sent straight to your inbox.
This document is a marketing communication and it may be produced and issued by the following entities: in the European Economic Area (EEA), by BlueBay Funds Management Company S.A. (BBFM S.A.), which is regulated by the Commission de Surveillance du Secteur Financier (CSSF). In Germany, Italy, Spain and Netherlands the BBFM S.A is operating under a branch passport pursuant to the Undertakings for Collective Investment in Transferable Securities Directive (2009/65/EC) and the Alternative Investment Fund Managers Directive (2011/61/EU). In the United Kingdom (UK) by RBC Global Asset Management (UK) Limited (RBC GAM UK), which is authorised and regulated by the UK Financial Conduct Authority (FCA), registered with the US Securities and Exchange Commission (SEC) and a member of the National Futures Association (NFA) as authorised by the US Commodity Futures Trading Commission (CFTC). In Switzerland, by BlueBay Asset Management AG where the Representative and Paying Agent is BNP Paribas Securities Services, Paris, succursale de Zurich, Selnaustrasse 16, 8002 Zurich, Switzerland. The place of performance is at the registered office of the Representative. The courts at the registered office of the Swiss representative or at the registered office or place of residence of the investor shall have jurisdiction pertaining to claims in connection with the offering and/or advertising of shares in Switzerland. The Prospectus, the Key Investor Information Documents (KIIDs), the Packaged Retail and Insurance-based Investment Products - Key Information Documents (PRIIPs KID), where applicable, the Articles of Incorporation and any other document required, such as the Annual and Semi-Annual Reports, may be obtained free of charge from the Representative in Switzerland. In Japan, by BlueBay Asset Management International Limited which is registered with the Kanto Local Finance Bureau of Ministry of Finance, Japan. In Asia, by RBC Global Asset Management (Asia) Limited, which is registered with the Securities and Futures Commission (SFC) in Hong Kong. In Australia, RBC GAM UK is exempt from the requirement to hold an Australian financial services license under the Corporations Act in respect of financial services as it is regulated by the FCA under the laws of the UK which differ from Australian laws. In Canada, by RBC Global Asset Management Inc. (including PH&N Institutional) which is regulated by each provincial and territorial securities commission with which it is registered. RBC GAM UK is not registered under securities laws and is relying on the international dealer exemption under applicable provincial securities legislation, which permits RBC GAM UK to carry out certain specified dealer activities for those Canadian residents that qualify as "a Canadian permitted client”, as such term is defined under applicable securities legislation. In the United States, by RBC Global Asset Management (U.S.) Inc. ("RBC GAM-US"), an SEC registered investment adviser. The entities noted above are collectively referred to as “RBC BlueBay” within this document. The registrations and memberships noted should not be interpreted as an endorsement or approval of RBC BlueBay by the respective licensing or registering authorities. Not all products, services or investments described herein are available in all jurisdictions and some are available on a limited basis only, due to local regulatory and legal requirements.
This document is intended only for “Professional Clients” and “Eligible Counterparties” (as defined by the Markets in Financial Instruments Directive (“MiFID”) or the FCA); or in Switzerland for “Qualified Investors”, as defined in Article 10 of the Swiss Collective Investment Schemes Act and its implementing ordinance, or in the US by “Accredited Investors” (as defined in the Securities Act of 1933) or “Qualified Purchasers” (as defined in the Investment Company Act of 1940) as applicable and should not be relied upon by any other category of customer.
Unless otherwise stated, all data has been sourced by RBC BlueBay. To the best of RBC BlueBay’s knowledge and belief this document is true and accurate at the date hereof. RBC BlueBay makes no express or implied warranties or representations with respect to the information contained in this document and hereby expressly disclaim all warranties of accuracy, completeness or fitness for a particular purpose. Opinions and estimates constitute our judgment and are subject to change without notice. RBC BlueBay does not provide investment or other advice and nothing in this document constitutes any advice, nor should be interpreted as such. This document does not constitute an offer to sell or the solicitation of an offer to purchase any security or investment product in any jurisdiction and is for information purposes only.
No part of this document may be reproduced, redistributed or passed on, directly or indirectly, to any other person or published, in whole or in part, for any purpose in any manner without the prior written permission of RBC BlueBay. Copyright 2023 © RBC BlueBay. RBC Global Asset Management (RBC GAM) is the asset management division of Royal Bank of Canada (RBC) which includes RBC Global Asset Management (U.S.) Inc. (RBC GAM-US), RBC Global Asset Management Inc., RBC Global Asset Management (UK) Limited and RBC Global Asset Management (Asia) Limited, which are separate, but affiliated corporate entities. ® / Registered trademark(s) of Royal Bank of Canada and BlueBay Asset Management (Services) Ltd. Used under licence. BlueBay Funds Management Company S.A., registered office 4, Boulevard Royal L-2449 Luxembourg, company registered in Luxembourg number B88445. RBC Global Asset Management (UK) Limited, registered office 100 Bishopsgate, London EC2N 4AA, registered in England and Wales number 03647343. All rights reserved.
Subscribe now to receive the latest investment and economic insights from our experts, sent straight to your inbox.
Please choose from the following
We are unable to market if your country is not listed.
You may only access the public pages of our website.